



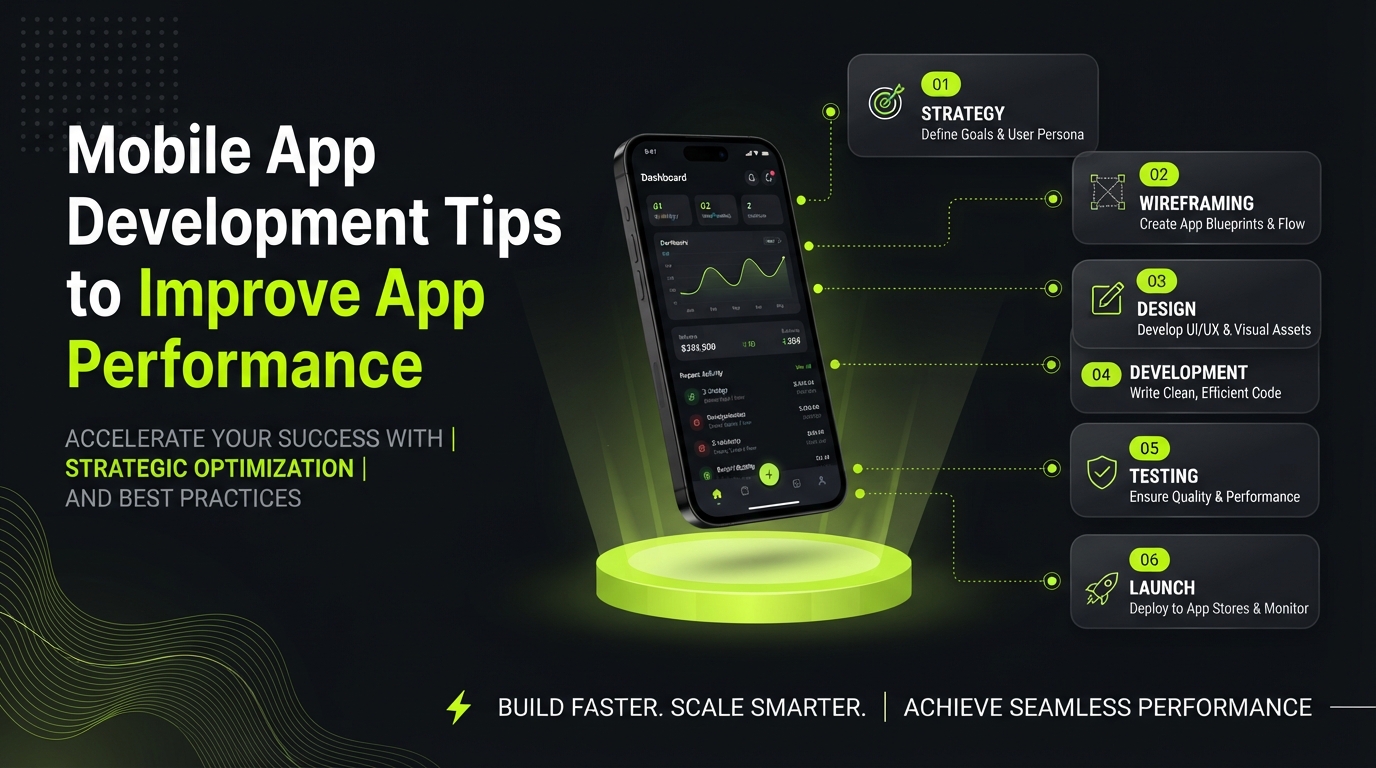
If your mobile application runs slower than a sleepy sloth on a hot afternoon, your users will trash it faster than bad cafeteria food.
Nobody cares about your shiny UI if the frame rate drops to single digits during a scroll action.
Deswave engineers build software that runs fast or dies trying. You are here because your app stutters, chokes memory, and drains phone batteries like crazy.
Stop shipping broken code. In this guide, we unpack critical mobile app development tips designed to squeeze raw power out of iOS and Android hardware. Let us fix your execution stack right now.
Identify Bottlenecks with Profiling Tools and Real Device Testing
Put an end to speculating about why your application slows. Blind code modifications disrupt functional modules and waste time.
Because emulators mislead about memory limits and thermal throttling, you need to examine hardware execution pathways on real physical hardware.
- In real time, Android Studio Profiler reveals garbage collection spikes, memory allocations, and thread contention.
- CPU core distribution, energy effect, and main thread blocking calls are revealed by Xcode Instruments.
- In production settings, Firebase monitoring keeps track of actual user payload latency and render frames.
Run CPU trace captures while the user is doing a lot of work. In the flame graph, look for broad blocks that show lengthy synchronous main thread executions.
Move the heavy work off the UI thread and fix those lengthy actions right away.
Optimize App Startup Time Cold Launch vs Warm Launch Strategies
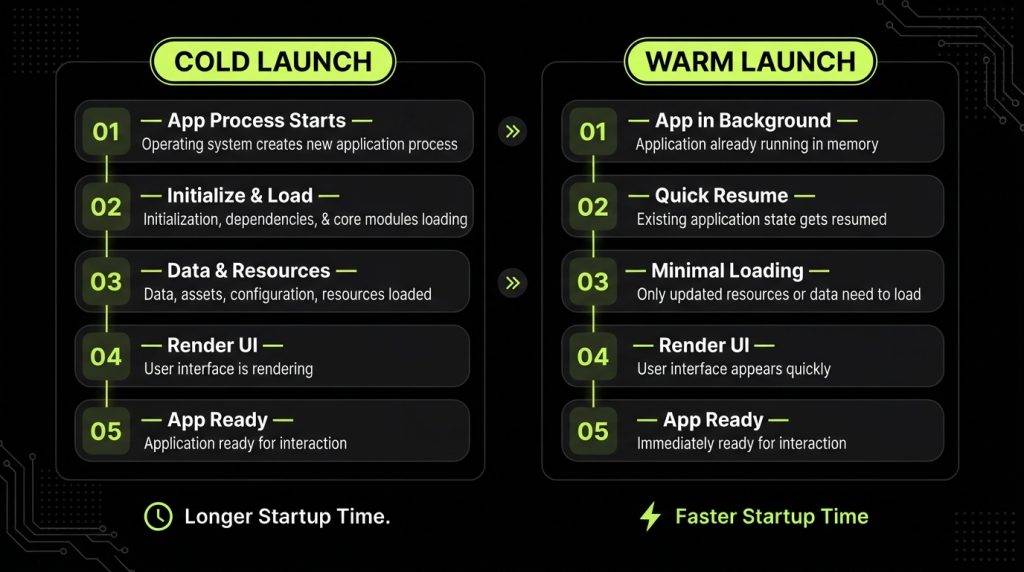
Users drop apps that take longer than two seconds to load. Cold launches force the operating system to create a new process, load dependencies, and initialise your application class. Warm launches rehydrate existing memory states.
- Lazy load non-critical SDKs during startup instead of running them inside Application onCreate or AppDelegate
- Defer third-party analytics initialisation until after the initial screen displays to the user
- Baseline Profiles on Android precompile critical code paths to bypass runtime bytecode interpretation
Remove blocking network calls from your launch sequence.
Fetch dynamic data asynchronously while rendering cached views immediately. Keep splash screen execution minimal and initialise background services only after the core user interface renders fully.
Reduce Memory Usage Avoid Leaks and Limit Large Allocations
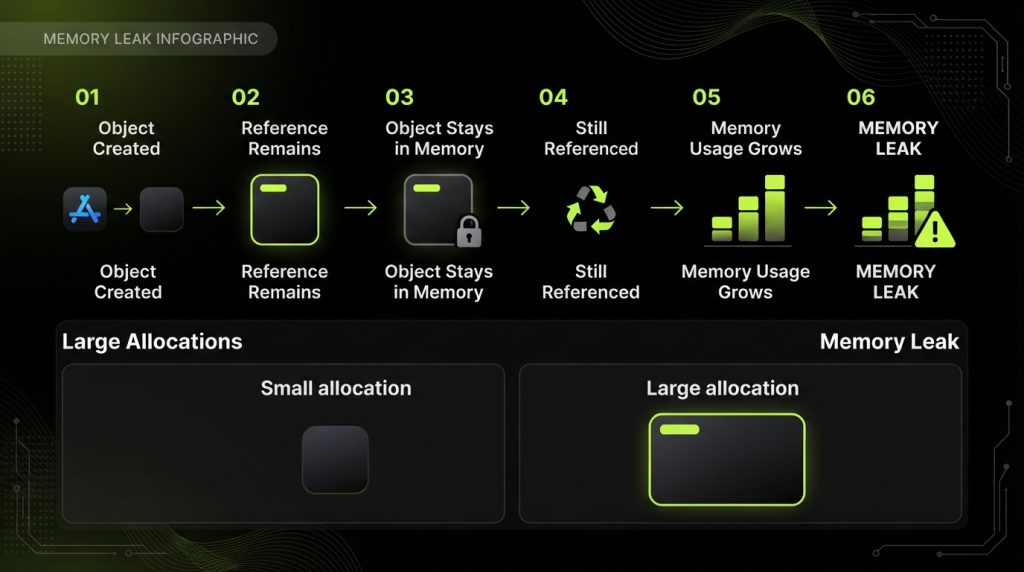
Out of memory crashes destroy user retention. Memory leaks happen when dead objects stay pinned in memory because dangling references prevent garbage collection.
- LeakCanary automatically catches retained activity and fragment references on Android build target devices
- Xcode Memory Graph Disassembler highlights retain cycles in Swift closures and unowned delegate references
- Object Pools recycle expensive allocations like bitmap buffers and network payload objects to avoid garbage collection pressure
Avoid static context references completely. Clear event listeners when views detach from the window hierarchy.
Watch for inner classes that hold implicit references to outer activity instances. Monitor native memory allocations alongside heap usage to stop memory growth before system low-memory signals trigger force kills.
Improve Scroll and UI Rendering Smoothness by Targeting Frame Rate
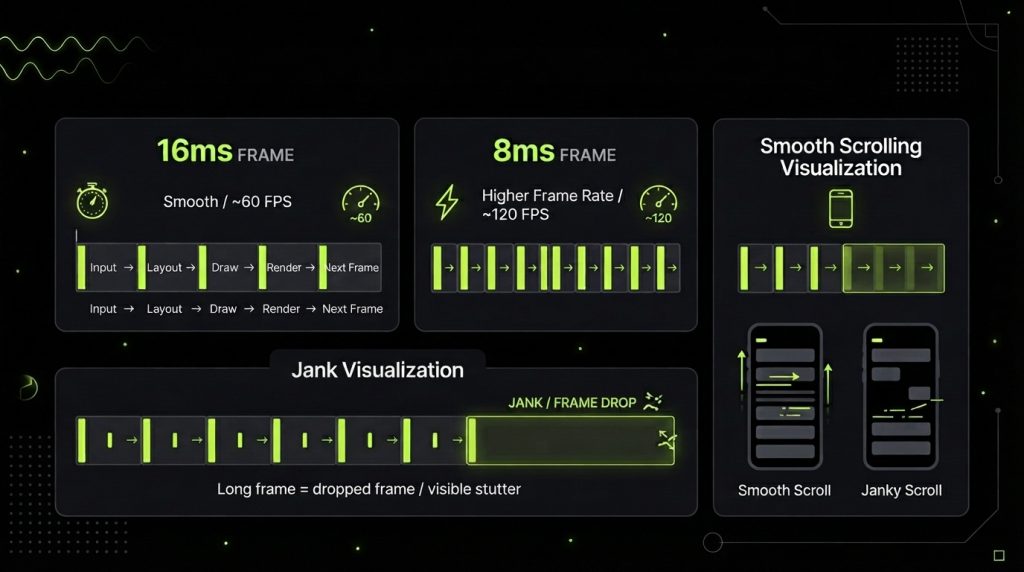
Modern displays refresh at sixty or one hundred twenty hertz. That gives your app sixteen or eight milliseconds to finish draw calls for every single frame. Missing those tight deadlines causes severe jank.
- RecyclerView and UICollectionView must reuse cell viewholders rather than inflating new XML layouts during fast scrolling actions
- Flatten view hierarchies to lower layout recalculation overhead and render tree traversal depth across complex layouts
- Enable hardware acceleration and offload complex graphics rendering to dedicated GPU hardware layers
Precompute text layouts off the UI thread before passing strings to rendering widgets. Avoid performing expensive string operations or object instantiations inside draw or layout passes.
Keep scroll listeners lean to protect frame rate consistency across all targeted device hardware.
Network Performance Tuning Latency Caching and Retry Logic
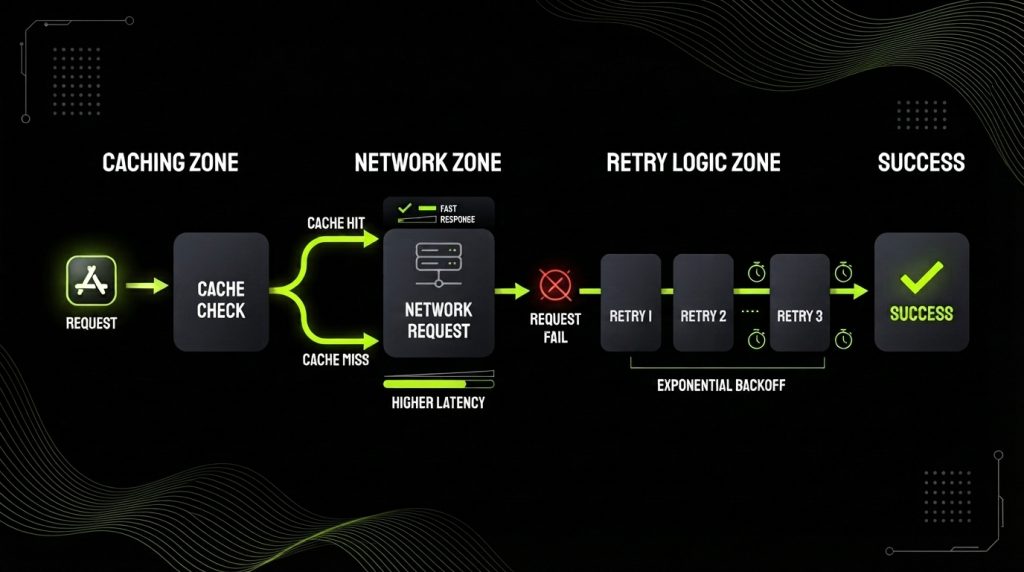
Slow networks ruin user experiences. Poor HTTP requests drain battery and unnecessarily flood system bandwidth. High-latency connections require smart networking logic.
- HTTP two multiplexing reduces connection overhead by streaming multiple network calls through one TCP connection
- HTTP response caching headers like ETag and Cache Control store static data locally to prevent duplicate round trips
- Exponential backoff algorithms delay network retries gracefully during connection drops instead of hammering backend servers continuously
Compress payload bodies using Gzip or Brotli compression. Use Protocol Buffers or compact JSON schema structures instead of bloated XML data formats.
Cancel pending network calls immediately when views unmount or screens are destroyed, to preserve system bandwidth and processing resources.
Use Efficient Data Loading Pagination and Lazy Retrieval
Downloading entire database records at once will crash your client application. Requesting huge datasets wastes cellular bandwidth and overwhelms client memory pools. Smart applications stream data as needed.
- Cursor-based pagination loads small page chunks while avoiding offset query performance degradations on backend databases
- Jetpack Paging and iOS Diffable DataSource present continuous data streams to scrolling views without UI freezes
- Prefetch next page bundles based on scroll velocity vectors before users hit the scroll boundary
Store fetched chunks inside local disk caches to allow instant offline rendering. Load heavy media elements lazily when item views enter the screen viewport.
Drop offscreen items from active memory caches when scrolling far past active window viewports to keep hardware memory overhead minimal.
Compress Images and Assets Without Breaking Visual Quality
Uncompressed images destroy mobile performance quicker than bad code. Loading raw camera images directly into image views will instantly trigger out-of-memory errors.
- WebP and AVIF image formats deliver smaller file sizes than legacy PNG or JPEG formats at identical quality levels
- Vector Drawables and SF Symbols scale cleanly across display densities without expanding APK or IPA asset footprints
- Downsample high-resolution images to exact target image view dimensions before rendering bitmaps into memory pools
Use Glide, Coil, or SDWebImage libraries to handle disk caching, memory caching, and asynchronous decoding automatically.
Strip EXIF metadata from user-uploaded images before processing. Serve responsive image resolutions based on target screen density points to keep network transfers small.
Optimize Database Access Indexing Queries and Migration Safety
Database queries running on the main thread cause UI freezes and application responsiveness failures. Unindexed queries scan entire tables and slow overall app execution.
- SQLite and Room indices speed up SELECT query lookup times on heavily queried table columns
- Transactions bundle multiple write operations together to minimise disk write head movements and block locking overhead across transactions
- Automated migration scripts prevent user data loss during app upgrades through verified database schema changes
Keep database reads off the main UI thread using coroutines or background threads. Avoid SELECT star queries when fetching specific properties from tables.
Run EXPLAIN QUERY PLAN on slow queries to identify missing indices and expensive table scans before pushing updates to app stores.
Improve CPU Usage Background Work Scheduling and Throttling
Unchecked CPU usage burns battery power and causes thermal throttling, which slows down the entire mobile device. Background tasks must yield system resources to active foreground user tasks.
- WorkManager on Android schedules deferrable background tasks while respecting battery saver modes and network state constraints
- BGTaskScheduler on iOS negotiates system background execution windows based on device power states and usage patterns
- Task throttling limits execution frequency for repeated background triggers like location updates or analytics pushes
Move non-urgent background tasks to charging windows. Batch background network synchronisation requests to keep cellular radios idle longer.
Release CPU wake locks immediately after background execution completes to allow processor cores to return to deep sleep states promptly.
Handle Concurrency Correctly Threads Tasks and Race Condition Prevention
Writing concurrent code without synchronisation locks causes state corruption, deadlocks, and unpredictable crashes. Developers must handle multithreading safely to maintain application stability.
- Swift Concurrency with async/await patterns eliminates nested callback hell and manages thread pool allocations safely across threads
- Kotlin Coroutines manage asynchronous execution through lightweight structured concurrency and main safety dispatches
- Mutex locks and atomic variables safeguard shared mutable state across competing worker threads
Never perform heavy calculations or file operations on the main thread. Always route UI state changes back to the main thread cleanly.
Test concurrent code paths using thread sanitisers to surface race conditions during local automated testing cycles before assembling release builds for deployment.
Minimize Battery Drain Energy Aware Scheduling and Sensor Control
Excessive power consumption leads to immediate app uninstallations. Applications that constantly poll hardware sensors, keep location services active, or hold wake locks continuously drain excessive battery power.
- Fused Location Provider fetches location coordinates using cached signals and lower accuracy modes when high precision is unnecessary
- JobScheduler delays background processing until device power sources plug in, saving battery power during active mobile use
- Sensor sampling rate adjustments reduce hardware polling frequency when screens turn off or apps enter background states
Stop sensor monitoring immediately when user interactions pause. Avoid continuous high-frequency GPS tracking unless navigating actively.
Combine sensor-batching features to read data in periodic bursts, keeping the main device application processor in deep sleep longer.
Speed Up Build Size with Modular Delivery and Dependency Hygiene
Bloated application downloads turn away prospective users on cellular data plans. Excess code dependencies swell binary sizes and unnecessarily increase runtime memory footprints.
- Android App Bundles split application packages into dynamic feature modules downloaded only when users require specific features
- ProGuard and R8 remove unused bytecode, shrink binary classes, and obfuscate code paths to reduce total APK size significantly
- Dependency hygiene audits remove redundant third-party libraries that duplicate existing native platform framework functions
Convert raster images to compact vector formats. Enable resource shrinking to prune unreferenced asset files automatically during production builds.
Monitor binary size metrics continuously to block heavy library additions before merging code into production development branches.
Fix App Stability Issues Crashes ANRs and Error Reporting Workflows
Unhandled exceptions and Application Not Responding events wreck user trust and trigger severe app store ranking penalties. Quick crash resolution requires automated crash monitoring workflows across all releases.
- Firebase Crashlytics groups stack traces automatically to identify top crashing code lines across production devices
- ANRWatchDog detects UI thread deadlocks by sending heartbeat pings to main thread message queues
- Symbolicated stack traces upload dSYM and mapping files to translate obfuscated memory addresses into readable source code lines
Catch expected exceptions gracefully without crashing application runtime states. Display user-friendly fallback screens when unexpected errors happen instead of abrupt app exits.
Prioritise crash fixes based on user impact metrics to protect overall application reliability.
Performance Regression Testing Keep Metrics Stable Across Releases
Performance degrades over time unless you lock it down with continuous automated testing routines. Unmonitored release builds slowly accumulate performance debt with every single new feature release.
- Jetpack Macrobenchmark measures startup times, frame rendering speeds, and CPU profile metrics inside CI CD build pipelines
- XCTest Performance Metrics track CPU usage, memory growth, and execution speed across automated test runs
- Performance gates automatically fail automated build pipelines when metric benchmarks fall below predefined thresholds
Compare pull request performance metrics against production baseline figures before merging code changes.
Run performance benchmark tests on physical test devices inside automated hardware labs. Keep performance metrics stable across releases to ensure continuous application speed and stability.
Frequently Asked Questions
Developers boost speed by profiling CPU threads on physical hardware, deferring noncritical launches, compressing assets, and caching network data.
Applying proven mobile app development tips helps teams eliminate lag, maintain sixty frames per second rendering, and prevent memory leaks before pushing code to production stores.
Engineers shorten startup delays by removing synchronous initialisation tasks from core launch sequences. Defer third-party analytics, lazy load secondary modules, and serve cached views instantly.
Using mobile app development tips like precompiling critical code paths helps applications render initial screens in under two seconds.
Fast applications keep users engaged while slow, stuttering interfaces drive immediate uninstallations. People demand instantaneous response times, smooth scrolling, and reliable stability.
Poor performance frustrates customers, damages brand trust, lowers app store visibility ratings, and directly cuts into long-term digital revenue metrics.
Converting raw graphics to WebP formats shrinks asset sizes without sacrificing visual clarity. Downsampling oversized bitmaps before decoding prevents out-of-memory crashes.
Applying smart mobile app development tips around visual media preserves network bandwidth, speeds up rendering pipelines, and reduces local storage requirements.
Clean, structured code keeps hardware operations lightweight and predictable. Developers prevent main thread freezes by running heavy database queries in background workers.
Smart data structures eliminate unnecessary loops, reduce CPU usage, prevent race conditions, and keep screen frame rates stable across devices.
Engineers control memory growth by removing static context references and clearing event listeners when views unmount.
Recycling bitmap buffers through object pools prevents garbage collection spikes. Following practical mobile app development tips helps teams spot retain cycles early and stop unexpected low-memory force kills.
Run performance tests during every automated build cycle and before every production release. Continuous profiling on real physical hardware catches CPU spikes, frame drops, and memory leaks before users ever encounter them.
Automated performance testing keeps system metrics stable as teams add features.
Engineers rely on Android Studio Profiler and Xcode Instruments to analyse local memory allocations and CPU usage.
Production teams track real user latency and crashes using Firebase Performance Monitoring and Crashlytics. Together, these tools provide full visibility across all hardware environments.
Flatten complex view trees to lower layout calculations on older processors. Limit heavy animations, reduce concurrent background tasks, and aggressively downsample graphic assets.
Implementing targeted mobile app development tips ensures smooth scrolling and quick response times even on budget or legacy mobile hardware.
Synchronous operations on the UI thread, unindexed database queries, and uncompressed image assets severely slow down mobile apps.
Dangling view references cause memory leaks that trigger sudden crashes.
Excessive network calls and unthrottled background polling drain phone batteries and block processor bandwidth.
Conclusion
Fast software wins users, while slow software gets deleted instantly. Applying these battle-tested mobile app development tips keeps your execution stack lean, stable, and responsive across all target hardware platforms.
Deswave engineers help developers eliminate main thread lag and ship high-performance digital products. Fix your codebase today, clean up memory leaks, and keep screen frame rates high.
Ready to Build a Faster, Smoother App?
Speed isn’t optional anymore it is what keeps users coming back. If your app needs real performance fixes, not just quick patches, Deswave engineering team can help. From startup time to memory leaks, we apply proven mobile app development tips that turn sluggish apps into fast, reliable products your users will love.